
Marketing ROI & Measurement
Y: Your funnel, explained

Tanner Wetzel
Founder, WithYou Digital
6 min read
Your team has 50 new inquiries. Is that good news?
It depends on what happens next. If most families book a tour and enroll, those inquiries are doing useful work. If only a handful schedule, your team has a very different problem to solve. That's why I want you to look past the lead total and follow the full enrollment journey.
This is the Y in the WYD roadmap: Your funnel, explained Once you can track inquiries, tours and enrollments consistently, the next step is figuring out where families stop moving forward and which group of families needs your attention.
Start with the four counts
For a defined group of inquiries, pull four numbers: inquiries, scheduled tours, completed tours and enrollments. Use the same definitions across your team and follow the same families through each stage where possible.
Then calculate:
- Inquiry to scheduled tour: scheduled tours divided by inquiries.
- Scheduled to completed tour: completed tours divided by scheduled tours.
- Completed tour to enrollment: enrollments divided by completed tours.
These rates help you see where a handoff needs attention. Keep the counts beside the percentages. A rate based on two families is much more sensitive to one outcome than a rate based on 200.
If you instead compare all activity occurring in one calendar month, say so. Some families who enroll this month may have inquired earlier, while recent inquiries may still be deciding. A cohort view that follows the same families gives you a clearer conversion picture, but it needs enough time for outcomes to mature.
Look at three different funnel shapes
In a workshop, we looked at three center examples to practice identifying the problem before choosing a solution.
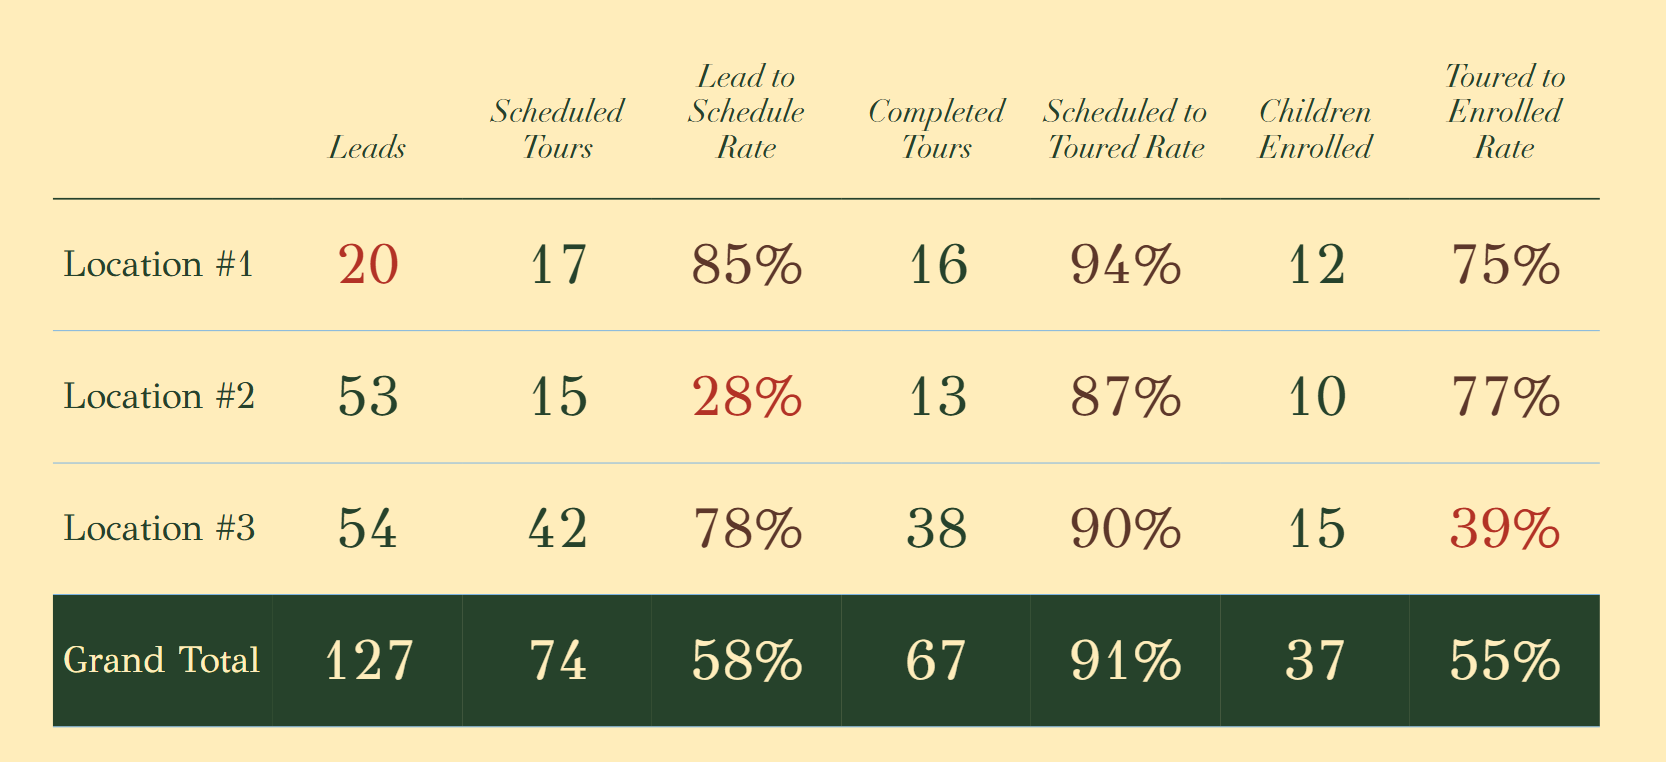
Read each stage separately: Location 1 has fewer inquiries, Location 2 loses more families before scheduling, and Location 3 loses more after touring.
The first center had 20 inquiries, 17 scheduled tours, 16 completed tours and 12 enrollments. That's 85% from inquiry to scheduled tour and 75% from completed tour to enrollment. The process is moving families forward. If more seats are available and the pattern holds over a larger period, the next question is whether the center needs more suitable inquiries.
The second had 53 inquiries, 15 scheduled tours, 13 completed tours and 10 enrollments. Only about 28% of inquiries scheduled a tour. Once families completed a tour, 10 of 13 enrolled. That points the investigation toward the early handoff rather than assuming the center simply needs more leads.
The third had 54 inquiries, 42 scheduled tours, 38 completed tours and 15 enrollments. Nearly 78% scheduled, but about 39% of completed tours became enrollments. That invites a closer look at what happens after a family visits and whether the center is attracting families whose needs match its available care.
These are starting points for questions, not proof of the underlying cause. One rate cannot tell you whether price, availability, follow-up or another factor is responsible.
Break the funnel down by classroom
A center-wide average can hide a problem in the room you most need to fill. In the second example, the infant classroom received 18 inquiries but only two scheduled tours. That is about 11%, substantially below the center's overall inquiry-to-scheduled rate.
Start by checking the records and the available seats. Were families asking for an immediate start when the next opening was months away? Were calls answered promptly? Did the same person follow up with each family? Did parents receive clear information about availability, hours and next steps?
Listen for repeated reasons, but separate a confirmed reason from a guess. If most records simply say “lost,” your first improvement may be asking the team to capture a useful reason when a family shares one.
Compare sources in the right context
Source matters, but a source label alone does not explain lead quality. In the third example, preschool inquiries attributed to Google included nine leads, three completed tours and no enrollments. That is a signal to investigate, not enough evidence to conclude that every Google inquiry is a poor fit.
Review the actual inquiries: requested age and start date, location, available spots, family questions and follow-up. Look at the search terms and messaging you can verify, as well as the page families reach. Are you attracting parents looking for the care you can provide now? Is the information they see consistent with what your team tells them?
When comparing channels, use the same funnel definitions and a comparable timeframe. Some families discover a center in one place and return through another, so source attribution is an estimate when the journey is incomplete. An unknown source is better than a confident guess.
Compare locations without oversimplifying
Locations can have different capacity, staffing, pricing, competition and demand. A lower conversion rate may reflect a real process problem, but it may also reflect a different mix of classrooms or families waiting for future openings.
Start with one comparable classroom or inquiry type. Ask each team to show how they respond to a new inquiry and schedule a tour. If one location has a strong process, its approach may be worth testing elsewhere. Do not assume that copying an ad budget alone will reproduce its results.
What lead quality actually means
For your center, a useful lead is a family whose needs align with the care you can offer, within a timeframe that works. Age, location, schedule and start date can all affect fit. A family who chooses another option is not automatically a bad lead, and a demographic assumption is not proof of quality.
This matters when you're trying to turn childcare inquiries into tours. If the fit is strong but families cannot reach your team, improve the handoff. If the fit is consistently poor, review the message, targeting and landing page. If there are no seats available, set expectations and adjust what you promote.
Take one funnel to your next team meeting
Choose a classroom with openings. Bring the four counts, the three rates, a note about the dates and a few actual inquiry records. Ask where the largest meaningful drop occurs, what evidence could explain it, and what the team needs to check next.
You do not need to solve every issue in one meeting. You do need to leave knowing which question deserves an answer before you spend more money. That's the bridge from understanding the funnel to deciding what comes next.